Have you ever used a product that had so many features, you had no idea where to start?
These products are usually built by software companies that have been around for a long time. This is known as feature bloat and it creates a tremendous amount of user confusion.
One way to solve this problem is to regularly evaluate existing features that are not core to your future product strategy. This is known as feature deprecation and it’s an important component of a feature’s lifecycle.
We’ve just launched a new SQL analytics project to help you answer the following question:
How do you analyse your user behaviour data to know if it’s okay to deprecate a feature?
Feature Deprecation Candidates
The first step is to develop a number of candidates for feature deprecation. A quick way to get this done is to build SQL queries to answer the following questions:
- What percent of active users have used each feature over the past month?
- What is the general trend of usage for each feature over time?
- What does retention look like for each feature?
You should consider re-evaluating the feature set available to users at regular intervals, perhaps quarterly or when your product strategy changes.
Power Users & High-Value Segments
You’ve now determined that not many users use the feature daily, weekly or monthly, depending on the typical engagement frequency of your product.
The biggest challenge with getting this type of analysis right is making sure you don’t remove a feature that valuable users actually want! There will always be some users who like a feature, but are there enough important users to justify the added complexity?
More importantly, who are these users who are still using this feature?
- Are they the top 5% of users who generate 95% of user engagement or revenue?
- Are they new users who use the feature once during their entire lifecycle?
- Are they very casual and irregular users?
- Are they life-long freemium users who don’t add much value to your business and have little prospect of converting?
One way to analyse power users by feature usage is to build a plot similar to the one below.
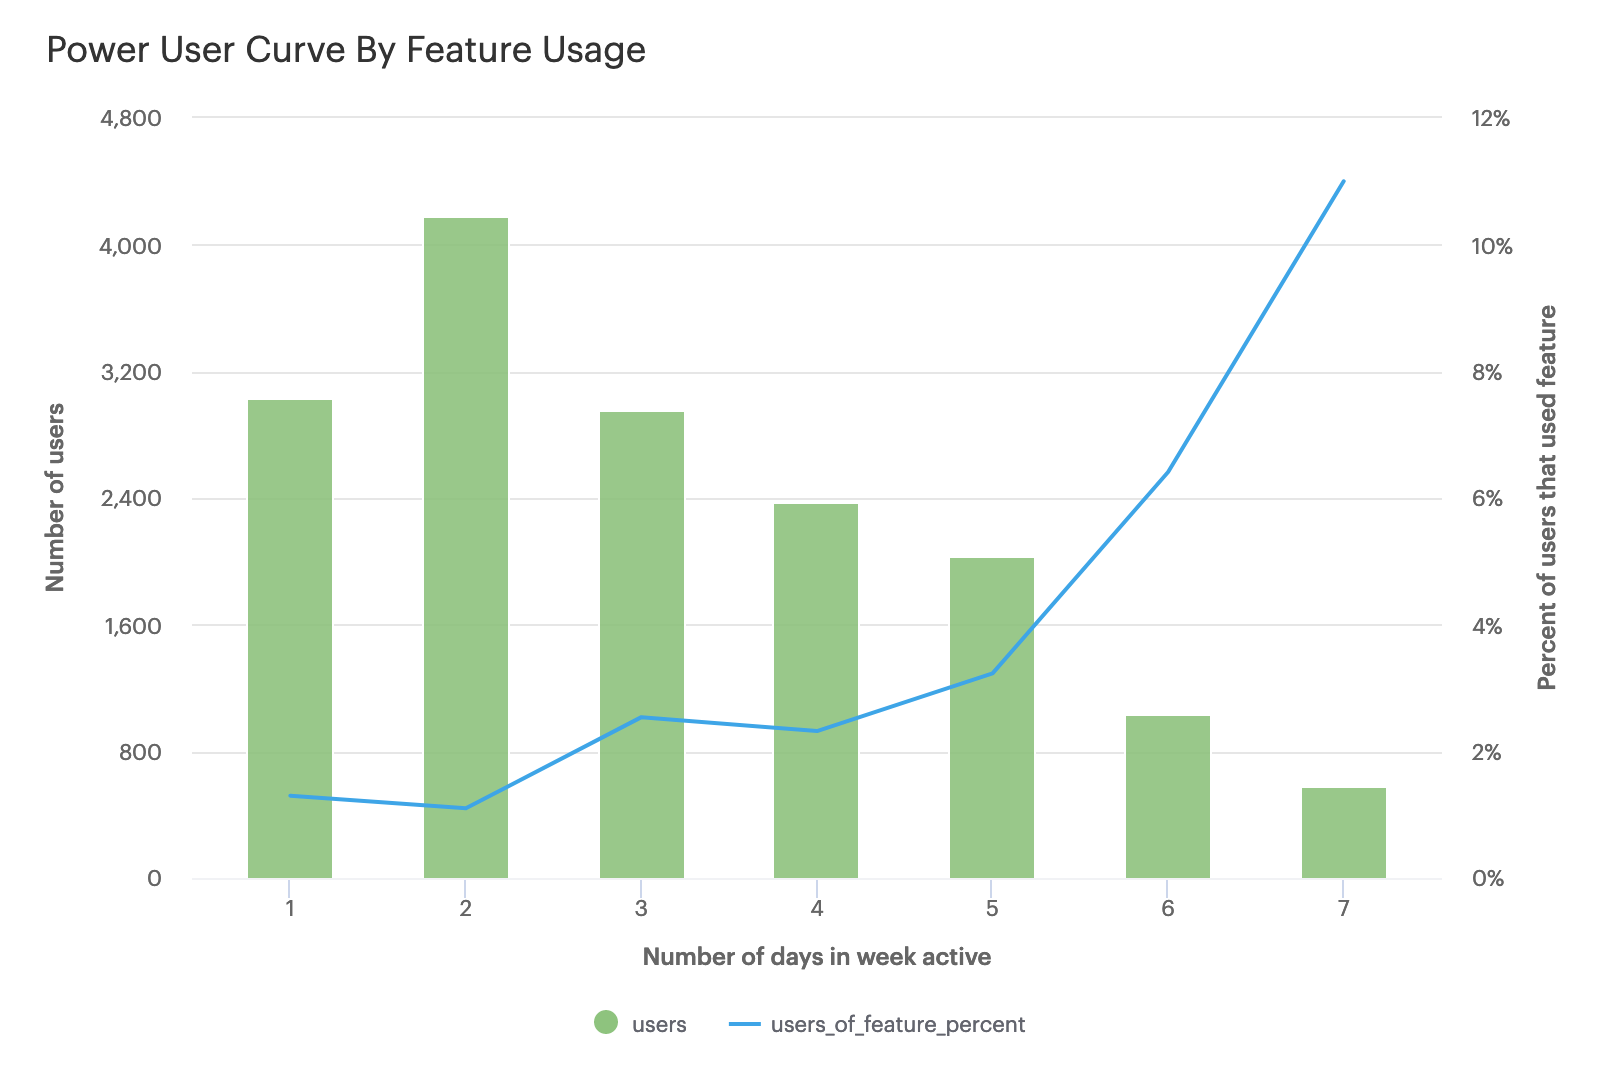
This is known as a power user curve. We can see that most users use our product 1-3 days per week and there are a much smaller number of power users (right side of chart). However, the power users use this feature much more than casual users as shown by the blue line.
If we simply calculated the total percent usage for this feature across our user base, we will come up with the incorrect conclusion that this feature isn’t important. In this case, we probably don’t want to upset power users and remove a feature that ~11% of them use.
When analysing data to determine if its okay to deprecate a feature, it’s important to remember that not all users are equal and understanding the nature of the usage of the feature is important to making the best decision.
It also goes without saying that you should run an A/B test to hide the feature for a subset of random users if at all possible to test the impact on your core product metrics prior to removing the feature completely.
To learn how to analyse your data to make the best feature deprecation decisions and build a plot similar to the one shown, start learning at supercooldata.com.