You’ve designed, built, A/B tested and finally launched your new product feature.
How should you monitor new feature usage and discovery?
We’ve just launched a new tutorial, or what we call a project, on supercooldata to explain how to do this with SQL.
When launching a new feature, we want to make sure that it actually solves a problem that users have.
In this project, we cover how to answer the following questions:
- What percent of daily users have had the opportunity to use the new feature?
- What percent of daily users have used the new feature on that day?
- What percent of daily users have ever tried the new feature?
Feature Discoverability
Often, a new feature is launched but it will be buried in the product and so usage might not be significant. Your existing users already have a particular pattern of behaviour when it comes to using your product. You need to gain the attention of existing users to ensure your product can actually be found.
Feature discovery ensures that users are aware of your new feature and it’s value proposition so that they can actually give it a go.
The first thing we need to monitor is the number and percent of users that have had impressions of your call to action to use the new feature.
Feature AARRR
AARRR stands for Acquisition, Activation, Retention, Referral, Revenue. It’s a common framework for analysing a product funnel.
AARRR metrics can also be set up to monitor each individual feature. We need to understand how many users have tried the feature for the first time each week, how many completed a key activation step and how many were retained.
I won’t go through AARRR metrics in detail here but the key point is that the same frameworks used to understand user behaviour and product success as a whole can be applied to each standalone feature.
New Feature Dispersion
Feature dispersion is the degree and rate of spread of your feature throughout your user base.
It’s similar to how a drop of food colouring disperses in a liquid.

Feature dispersion seeks to answer the following questions:
- How many users have ever had the opportunity to use the feature?
- How many users have ever used the feature?
For example, if we take a look at the plot below, we can see that the new feature was launched on the 1st of March.
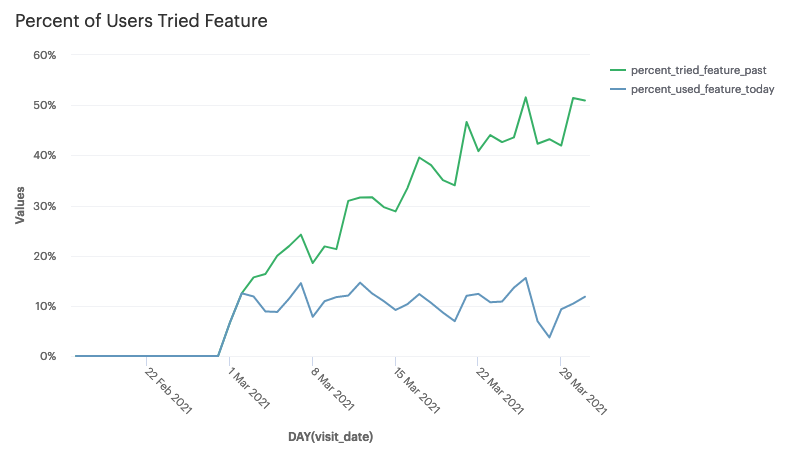
Each day after launch, we have about 10% of daily active users who have used the feature (blue line).
We can also monitor what percent of daily active users have tried the feature in the past (green line).
The green line will eventually reach some maximum at which point the feature has fully dispersed in the user base.
If the daily usage of the feature is below what we expect and knowledge of the new feature has fully dispersed among the user base, we no longer have a feature acquisition problem, but a re-activation/retention problem. It would be clear at what point in time after launch, most users who wanted to give it a go actually tried the feature.
Once a feature has fully spread among your users and reached some level of stable usage, you can now consider different strategies to drive higher feature engagement.
To learn how to analyse and monitor your new feature launch with SQL, sign up at supercooldata.com.